|
|
Post by patrmac04 on Jan 28, 2014 1:07:37 GMT -5
Has anyone seen a study on what percentage of MLB players ever appeared on a top 100 list? It'd probably be done using the BA list. I wonder how many current major leaguers were ever listed in the top 100. I'm pretty sure the failure rate of the top 100 is about 75%. It depends on the definition of success. If you define success as making the major leagues then almost all of them do. Definition of success by WAR according to the article is as such: 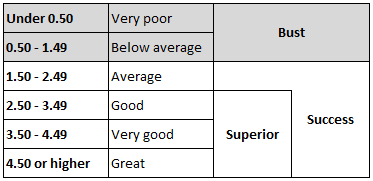 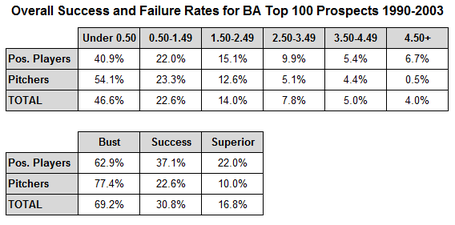 |
|
|
|
Post by moonstone2 on Jan 28, 2014 11:02:29 GMT -5
Has anyone seen a study on what percentage of MLB players ever appeared on a top 100 list? It'd probably be done using the BA list. I wonder how many current major leaguers were ever listed in the top 100. I'm pretty sure the failure rate of the top 100 is about 75%. I'd be interested in that too. I'd also be interested in some context to the numbers given in the SB Nation article. Prospects are obviously a high beta enterprise, is a 70% failure rate bad or to be expected? |
|
|
|
Post by jchang on Jan 28, 2014 11:31:07 GMT -5
Given that just more than half of the this year's MLB top 100 had a grade of 55, which is just moderately above average, I would not consider a final outcome of below average to be a true bust (in assessment).
This year, only one had a grade of 70 or higher with another 17 at 65, and 30 or so at 60. So that would seem to indicate that the grading scheme for the prospects is conservative in giving out 70's, but there are perhaps 2X more getting 60-65 than what ultimately pans out. I would say that is a reasonable - 1 proven player worth 2 prospects.
So if the bulk of the prospects are getting on average a grade 10 points higher than what is actually realized, that would mean the bottom half of the TOP 100 are really grade 45's. Then an ultimate MLB career in the WAR .5-1.49 range should not be considered a bust.
|
|
|
|
Post by patrmac04 on Jan 28, 2014 11:43:54 GMT -5
I like the way they ranked the prospects into groups of 10 so the prospects are ranked into groups 1-10, 11-20, 21-30... etc. This way the sample size is bigger and gives a better statistical analysis of prospects. This shows a much better picture IMO about how often prospects bust out. Looks like pitchers bust out much much more often than position players in the top 100 rankings. www.royalsreview.com/2011/2/14/1992424/success-and-failure-rates-of-top-mlb-prospects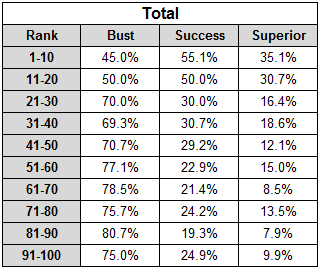 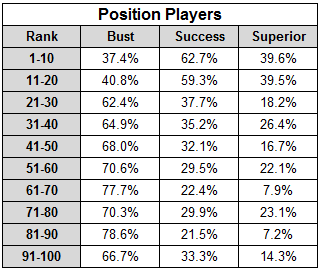  From these metrics... prospects 1-20 have about the same bust rate as do 21-50. From there 51-100 are almost the same as well... so statistically speaking prospects 1-20, 21-50 and 51-100 all have almost identical rates of success and being busts. |
|
|
|
Post by jchang on Jan 28, 2014 12:13:26 GMT -5
Wow, having this detailed data is really great! And of course I have suggestions/opinions on interpreting the data. Instead of the absolute success/bust assessment, I suggest rating outcome relative to prediction.
Lets assumes the top 20 are expected to be Very Good (WAR 3.5+) or better, and the 21-40 group to be Good (2.5-3.49) and the 41-100 to be Average (1.5-2.49).
Then it seems that the prospect have a 30-40% of turning out at their assessed grade level, plus or minus 1 level. Also, there is not a huge difference in the success of the 41-100 group (the 41-60 having better chance of being good).
|
|


